


Making Mermaid Diagrams in Markdown
diagrams and flowcharts have been gaining traction, especially with that they are natively supported in Markdown. Let’s take a look at what they are, how to use them, and just as importantly: why.
Just like you might want to directly in your documentation source, having your diagrams and charts live adjacent to your text helps prevent them from rotting — that is, drifting out of sync with the state of your document. Just as unhelpful, obsolete, or otherwise misleading comments in your code can be objectively worse than no comments, the same goes for diagrams.
Mermaid diagrams pair well with and , which continue to grow in popularity. The pairing is natural. While Mermaid diagrams aren’t Markdown-exclusive, they are Markdown-inspired. Using the same markup abstractions Markdown provides to notate code, Mermaid can be represented the same to output diagrams and flowcharts. And Markdown is to Jamstack and static sites as peanut butter is to jelly.
If your site is authored in Markdown, processed into HTML, and you have enough control to add a bit of custom JavaScript, then you can use the ideas we’re covering in this article to fit your own needs and implement diagrams with Mermaid conveniently alongside the rest of your Markdown. Is “diagrams-as-code” a term yet? It should be.
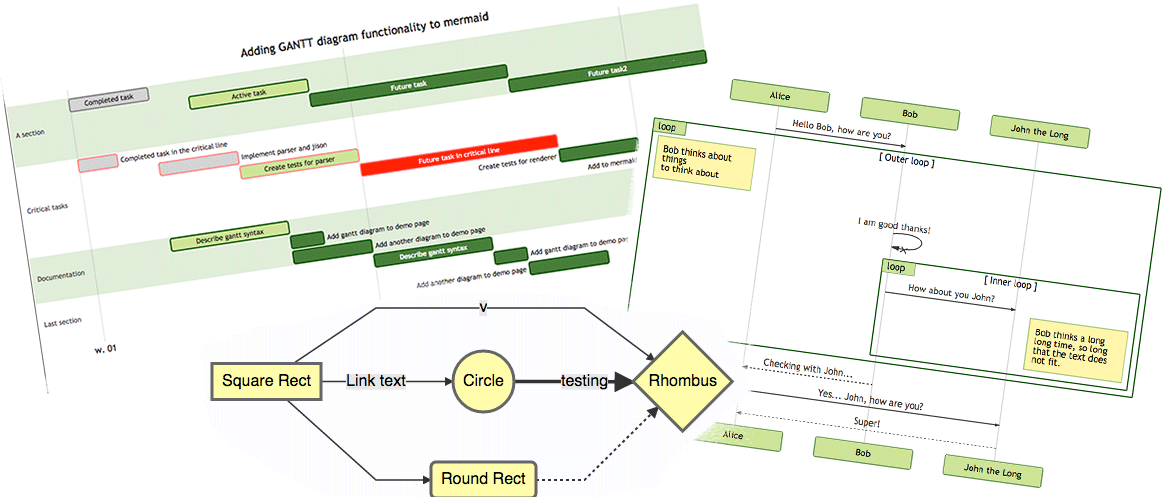
For example, let’s say you’re working on a fancy new product and you want to provide a roadmap in the form of a (or — say flowcharts, sequences, and class diagrams). With Mermaid, you can do this in a small handful of lines:
gantt title My Product Roadmap dateFormat YYYY-MM-DD section Cool Feature A task :a1, 2022-02-25, 30d Another task :after a1, 20d section Rad Feature Task in sequence :2022-03-04, 12d Task, No. 2 :24dWhich will render a nice SVG diagram like so:
Nine lines of code gets us a full-fledged Gantt chart that can be used for product roadmaps and such.

Dan
I'm want to become a junior web developer